PARTICIPANT DATA
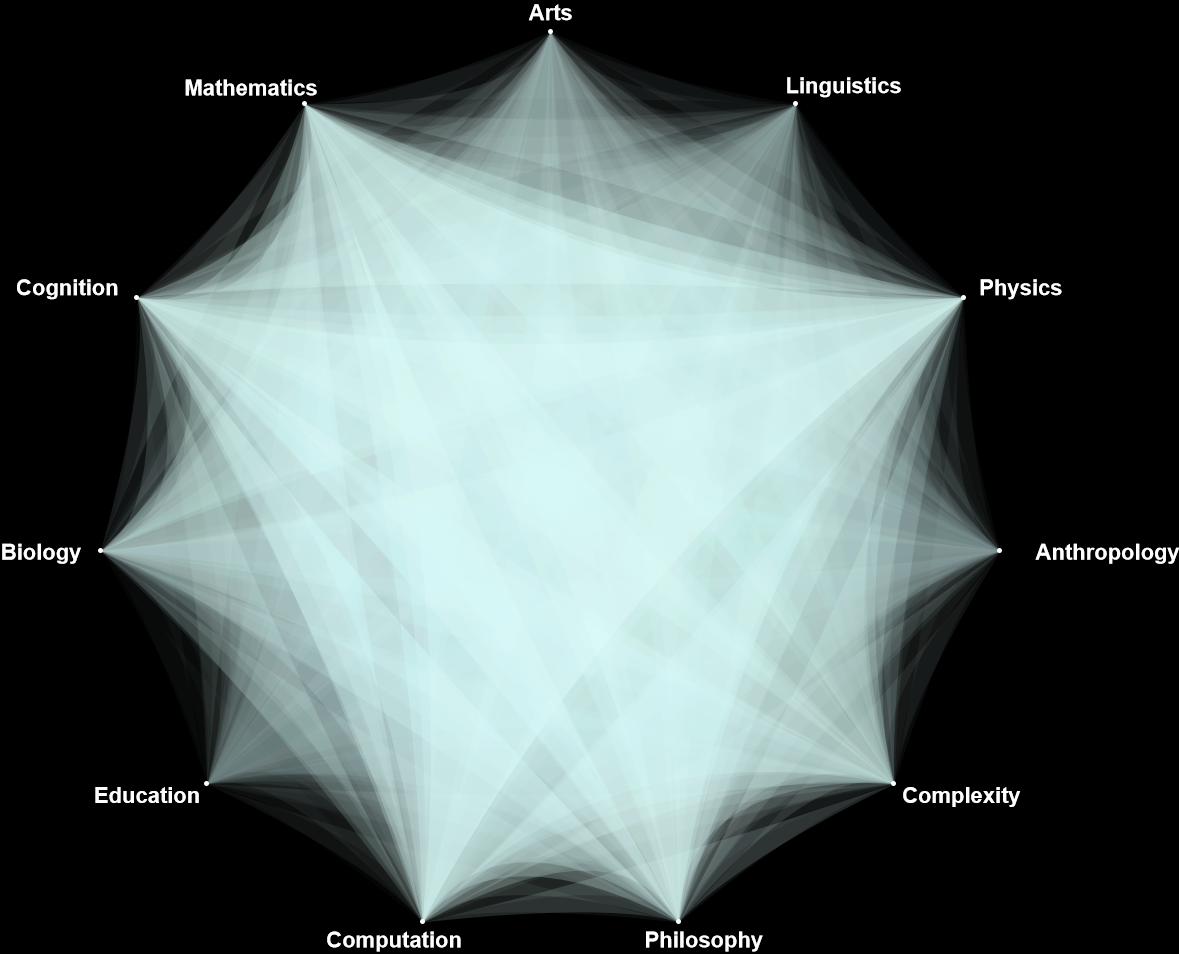
DISCIPLINARY HYPERGRAPH
Complete dataset generated from participant answers to ‘What disciplines better represent your research activity or interests?’. Each datapoint is a shape (hyperedge) connecting some collection of disciplines. Shade intensity is proportional to the number of datapoints in that region of the diagram.
Interdisciplinary Depth
A profile of hyperedge order distribution. The horizontal axis shows the number of disciplines chosen by individual participants.
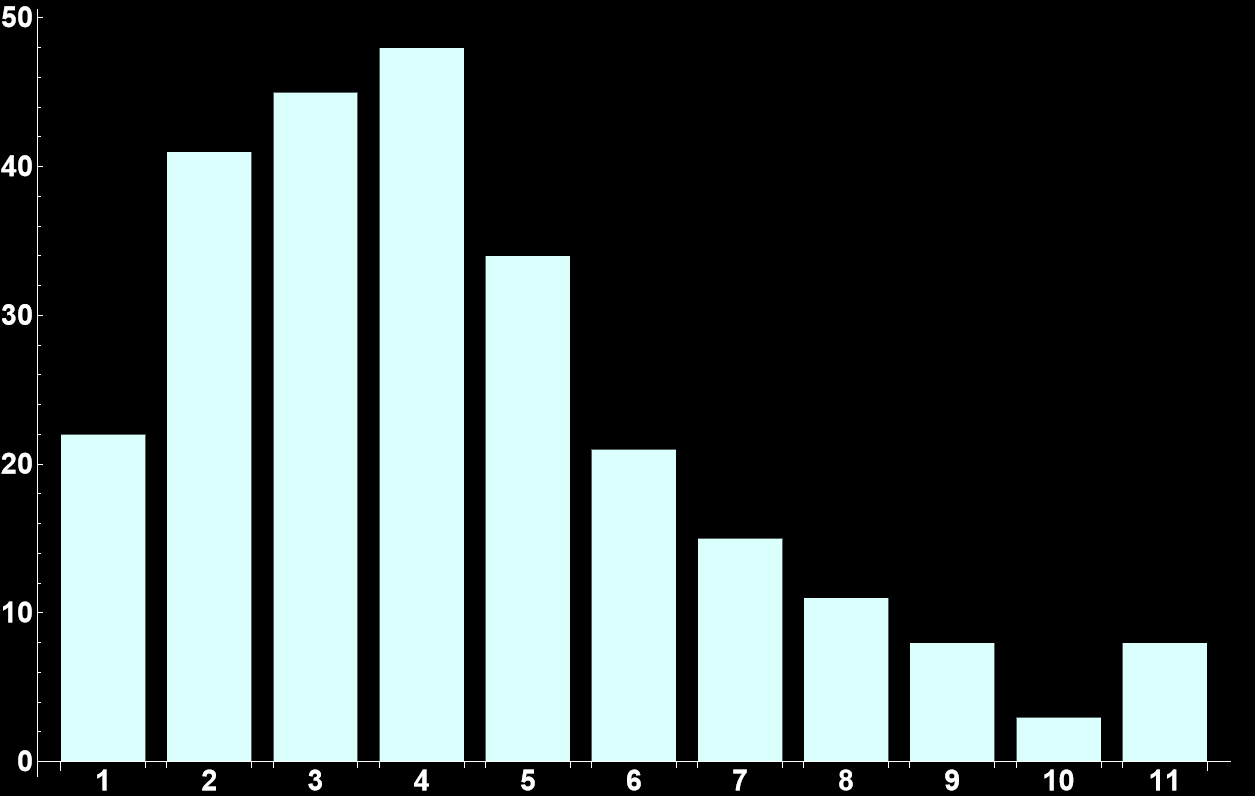
Number of Chosen Disciplines
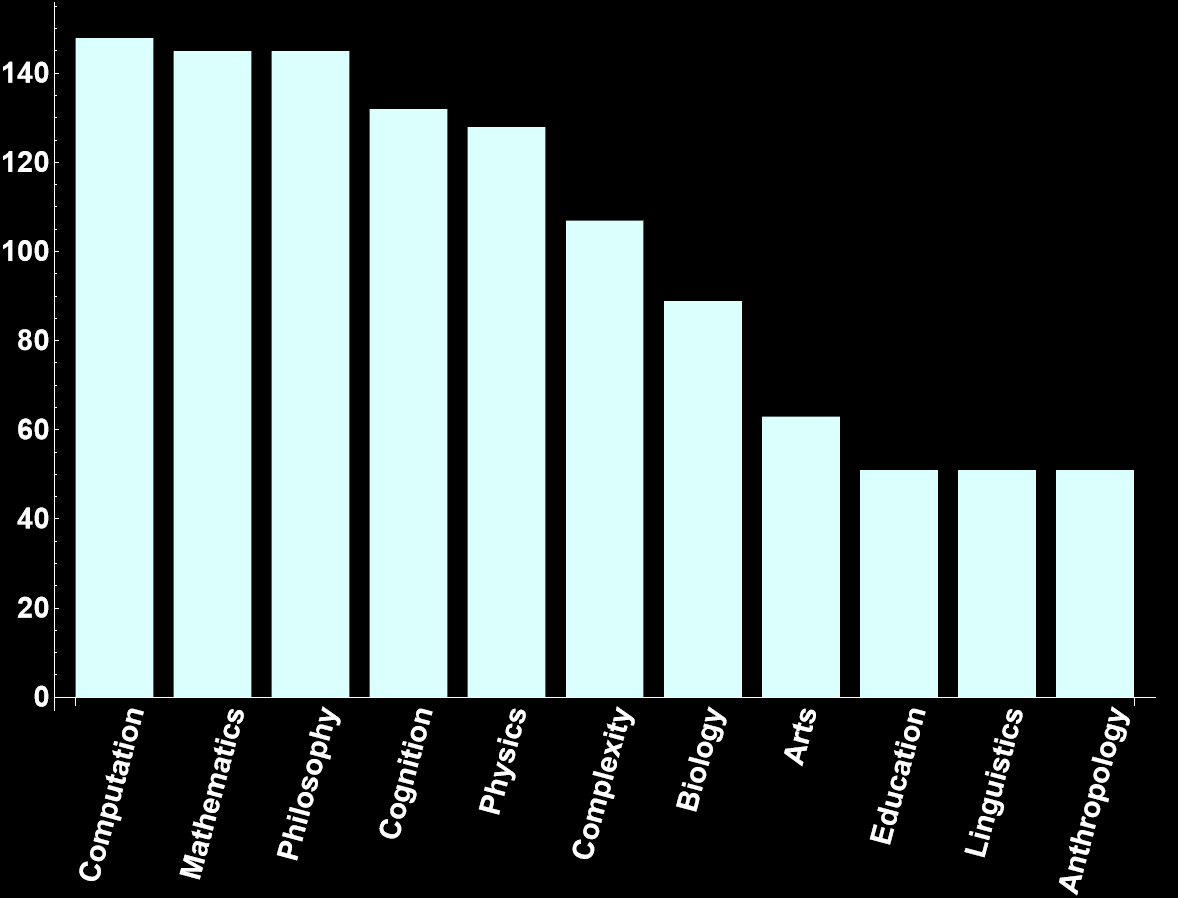
Disciplinary Representation
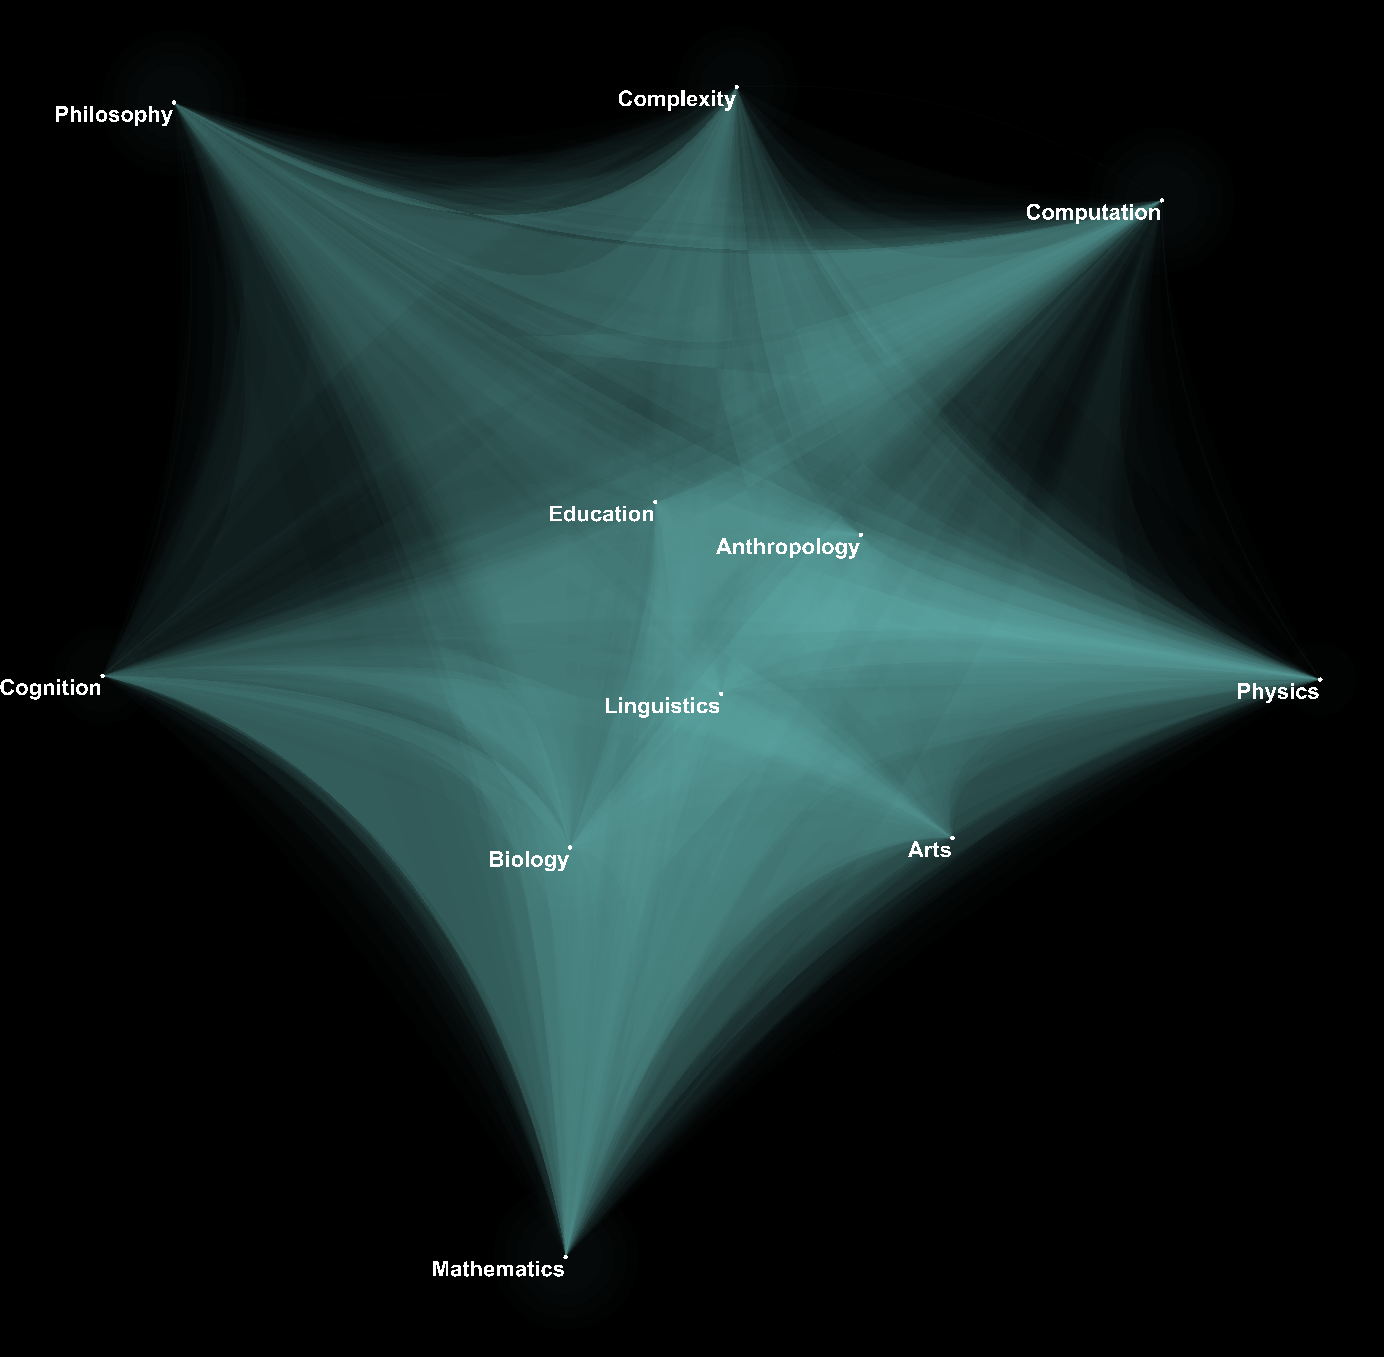
A unary reduction of the Disciplinary Hypergraph: each individual mention of a discipline is counted separately.
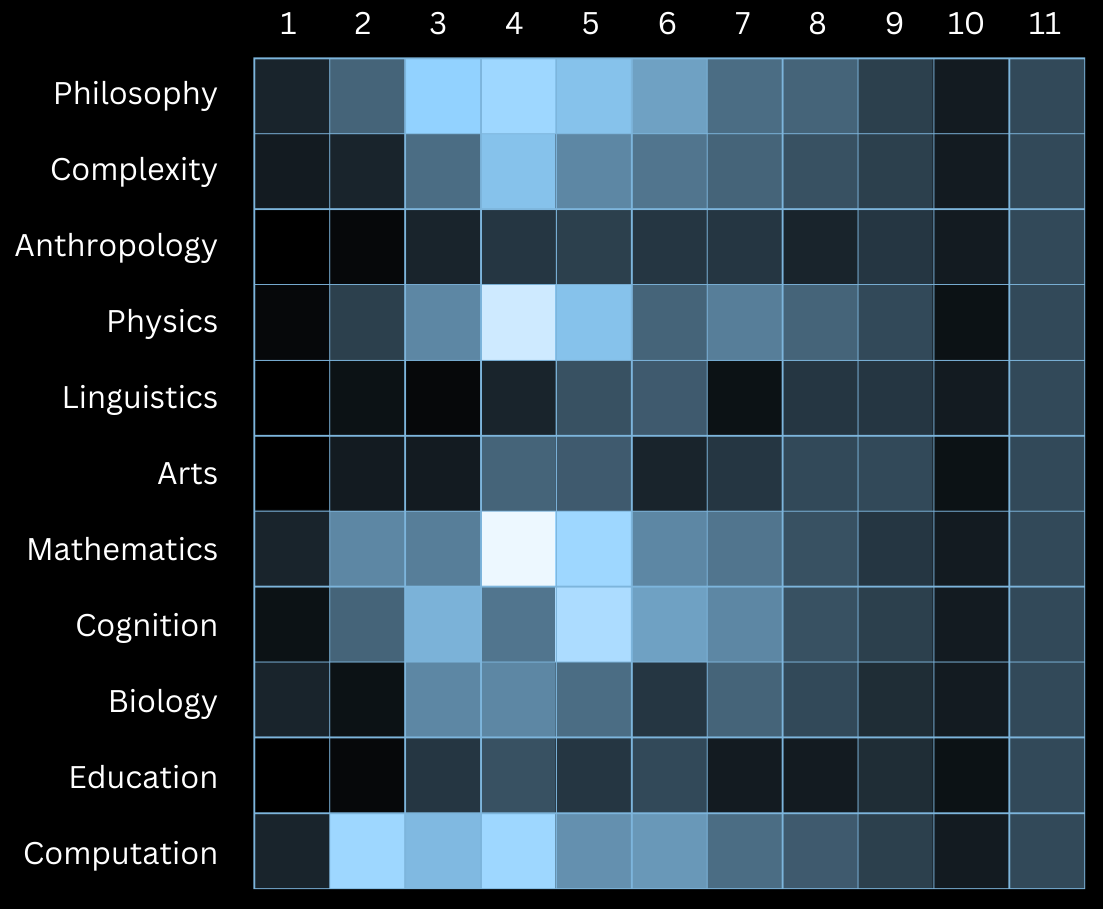
Interdisciplinarity Distribution
A frequency matrix representation of disciplines and the size of hyperedges in which they occur. The color intensity of each entry is proportional to the number of times a discipline appeared in an answer naming a group of disciplines. For example, an answer selecting “Mathematics, Art, Cognition” contributes a count on the tiles of each of the rows of those disciplines intersecting with column “3”.
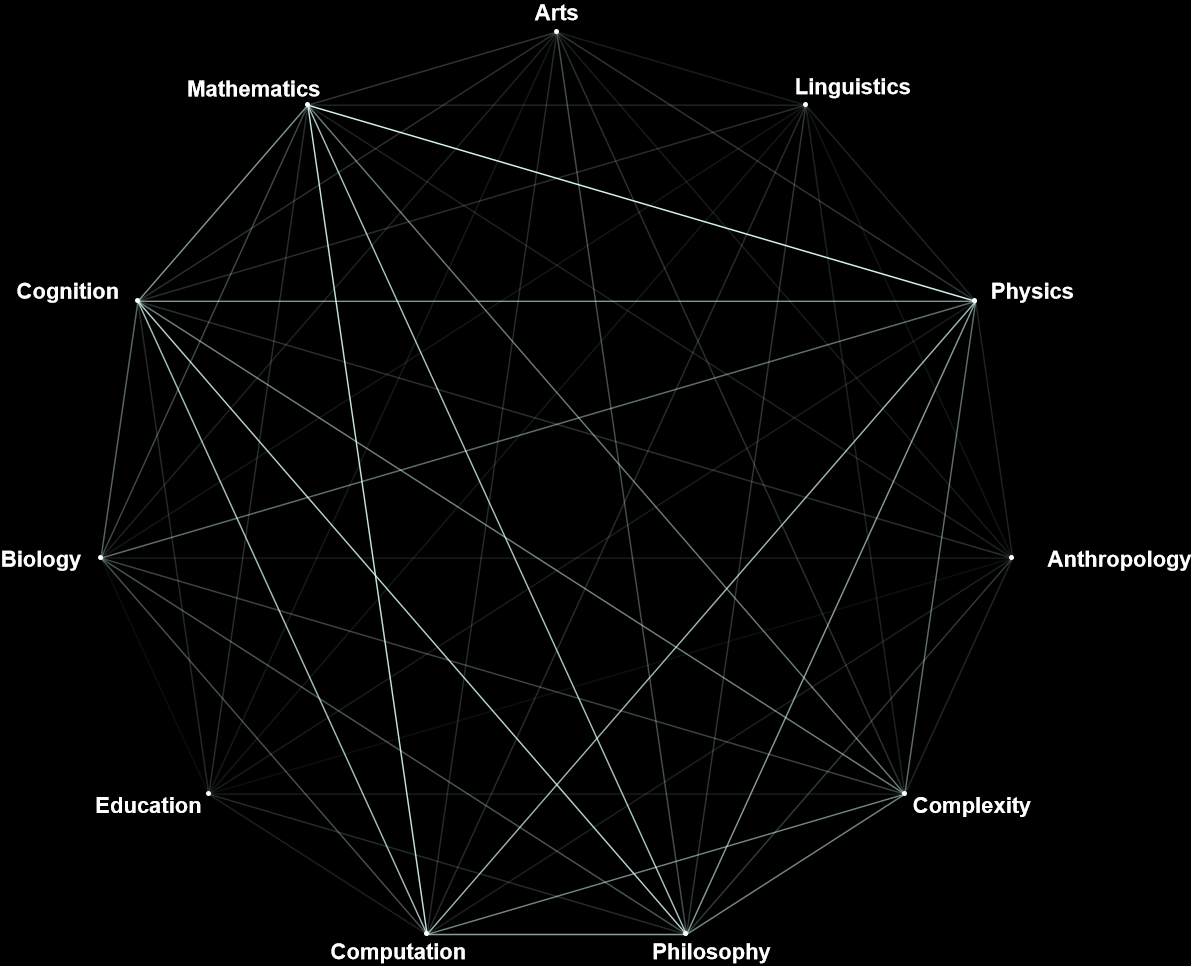
Binary Interdisciplinarity
A binary reduction of the Disciplinary Hypergraph: all hyperedges of order 3 and greater are decomposed into their binary subsets. On the left, the reduced Disciplinary Hypergraph where edge color intensity proportional to relative frequency. On the right, a chord diagram summarising unary and binary data: sector lengths are proportional to the number of instances participants selected each discipline; chord widths are proportional to the number of instances that pair of disciplines occurs in the entire dataset, hovering over them with the mouse shows exact counts.